Machine learning metrics - Precision, Recall, F-Score for multi-class classification models
Anyone familiar with the confusion matrix knows that most of the time it is explained for a binary classification problem. Well, in this article we will extend applying confusion matrix on multi-class machine learning models.
A confusion matrix is represented in a tabular format to visualize the performance of our prediction model. Every entry logged in the confusion matrix (table) indicates the number of predictions made by the model where it classified the classes correctly or incorrectly.
Confusion matrix for Binary Classification
The confusion matrix table mainly consists of 4 entries they are:
1. True Positive (TP):
Definition 1: The model correctly predicted Yes
Definition 2: Number of predictions where the classifier correctly predicts the positive class as positive.
2. True Negative (TN):
Definition 1: The model correctly predicted No.
Definition 2: Number of predictions where the classifier correctly predicts the negative class as negative.
3. False Positives (FP):
Defination 1: The model falsely predicted Yes
Definition 2: The number of predictions where the classifier incorrectly predicts the negative class as positive.
4. False Negatives (FN):
Defination 1: The model falsely predicted No
Definition 2: “The number of predictions where the classifier incorrectly predicts the positive class as negative.
Confused… ![]()
Let me make it simple with an example to understand
Problem: Suppose we are working on a binary classifier to predict whether the patient is sick or healthy.
Given, **positive** (the patient is sick) or **negative** (the patient is healthy)
Let us run our classifier on 1000 patient’s data and enter the model predictions.
| Predicted sick (positive) | Predicted healthy (negative) | |
|---|---|---|
| Sick patients (positive) | 100 True Positives (TP) |
30 False Negative (FN) |
| Healthy patients (negative) | 70 False Positives (FP) |
800 True Negatives (TN) |
Let’s sum up the values of TP, TN, FP, FN out of 1000
TP: 100
TN: 800
FP: 70
FN: 30
Now we use these measures from the confusion matrix to calculate the ML metrics such as
1. Accuracy
2. Precision and Recall
3. F-Score
Let’s understand each metric detail ![]()
1. Accuracy
The accuracy metric gives the overall accuracy of the model, meaning the fraction of the total samples that were correctly classified by the classifier.
Accuracy is calculated as:
2. Precision and Recall
Recall (also known as sensitivity) tells us how many times did the model has incorrectly classified as negative class (FN).
Recall is calculated as:
Precision (also known as specificity) is the opposite of recall. It tells us how many times did the model incorrectly diagnose as a positive class (FP)
F-score In many cases, we want to summarise the performance of a classifier with a single metric that represents both recall and precision. To do so, we can convert precision (p) and recall (r) into a single F-score metric. mathematically, this is called the harmonic mean of p and r
Confusion matrix for Multi-class classification
Let’s consider our multi-class classification problem to be a 3-class classification problem. suppose we have a three-class label, namely Cat, Dog, and Rat. The following is a possible confusion matrix for these classes.
| Dog | Cat | Rat | |
|---|---|---|---|
| Dog | 20 | 6 | 8 |
| Cat | 1 | 15 | 3 |
| Rat | 8 | 4 | 26 |
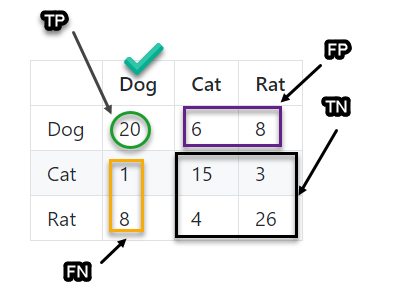
Unlike binary classification, there are no positive or negative classes here. Instead, we have TP, TN, FP, and FN for each class.
Let’s calculate the accuracy of class Dog, let us see the values from the confusion matrix.

-
TP = 20
-
TN = (15 + 3 + 4 + 26) = 48
-
FP = (6 + 8) = 14
-
FN = (1 + 8) = 9
Calculating metrics for class dog
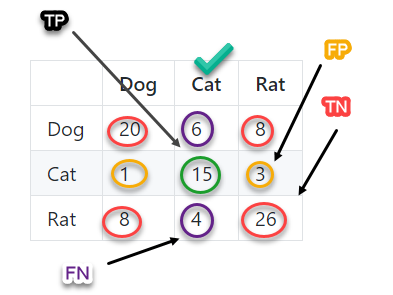
Similarly, let’s calculate the accuracy of Class Cat, let us see the values from the confusion matrix

-
TP = 15
-
TN = (20 + 26 + 8 + 8) = 62
-
FP = (1 + 3) = 4
-
FN = (6 + 4) = 10
Similarly, we can calculate the measures for the other classes. Here is a table that shows the values of each measure for each class.
| Class | Precision | Recall | F1 - Score |
|---|---|---|---|
| Dog | 0.58 | 0.68 | 0.63 |
| Cat | 0.78 | 0.60 | 0.68 |
| Rat | 0.70 | 0.68 | 0.69 |
Identifying an appropriate metric
Choosing a better metric depends on use cases, for example, In health diagnostics, we may consider the recall metric which indicates how many of the sick patients our model incorrectly diagnosed as well. TO identify the most appropriate metric for your problem, ask yourself which of the two possible false predictions is more consequential: False Positive (FP) or False Negative (FN). If your answer is FP, then you choose for precision. If FN is more significant, then recall is will be the metric.
Let us consider another example, *Spam email classifier,
Which of the two false predictions would you care about more:
-
Falsely classifying a non-spam email as spam
-
Falsely claiming a spam email as non-span.
I believe we care more about point 2 since we don’t want the receiver to lose an email because our model misclassified it as spam. We want to block spam and at the same time avoid losing a non-spam email. So in this use case, precision can be a suitable metric to use.
In some use cases, we care about the precision and recall at the same time. That’s called an F-Score.
That’s it !!!
Let’s catch up in the next article ![]() discussing Object detector evaluation metrics
discussing Object detector evaluation metrics

