Object detector Framework
Prior understansing about the object detection systems like R-CNN, SSD and YOLO, we should know the common similarity (standard approach) used to detect objects and metrics defined to evaluate the performance of the object detection model.
The Object detection models mainly has four components
1. Region proposal
2. Feature extraction and network predictions.
3. Non-maximum supression (NMS)
4. Evaluating Object detectors
Let’s begin
1. Region proposals

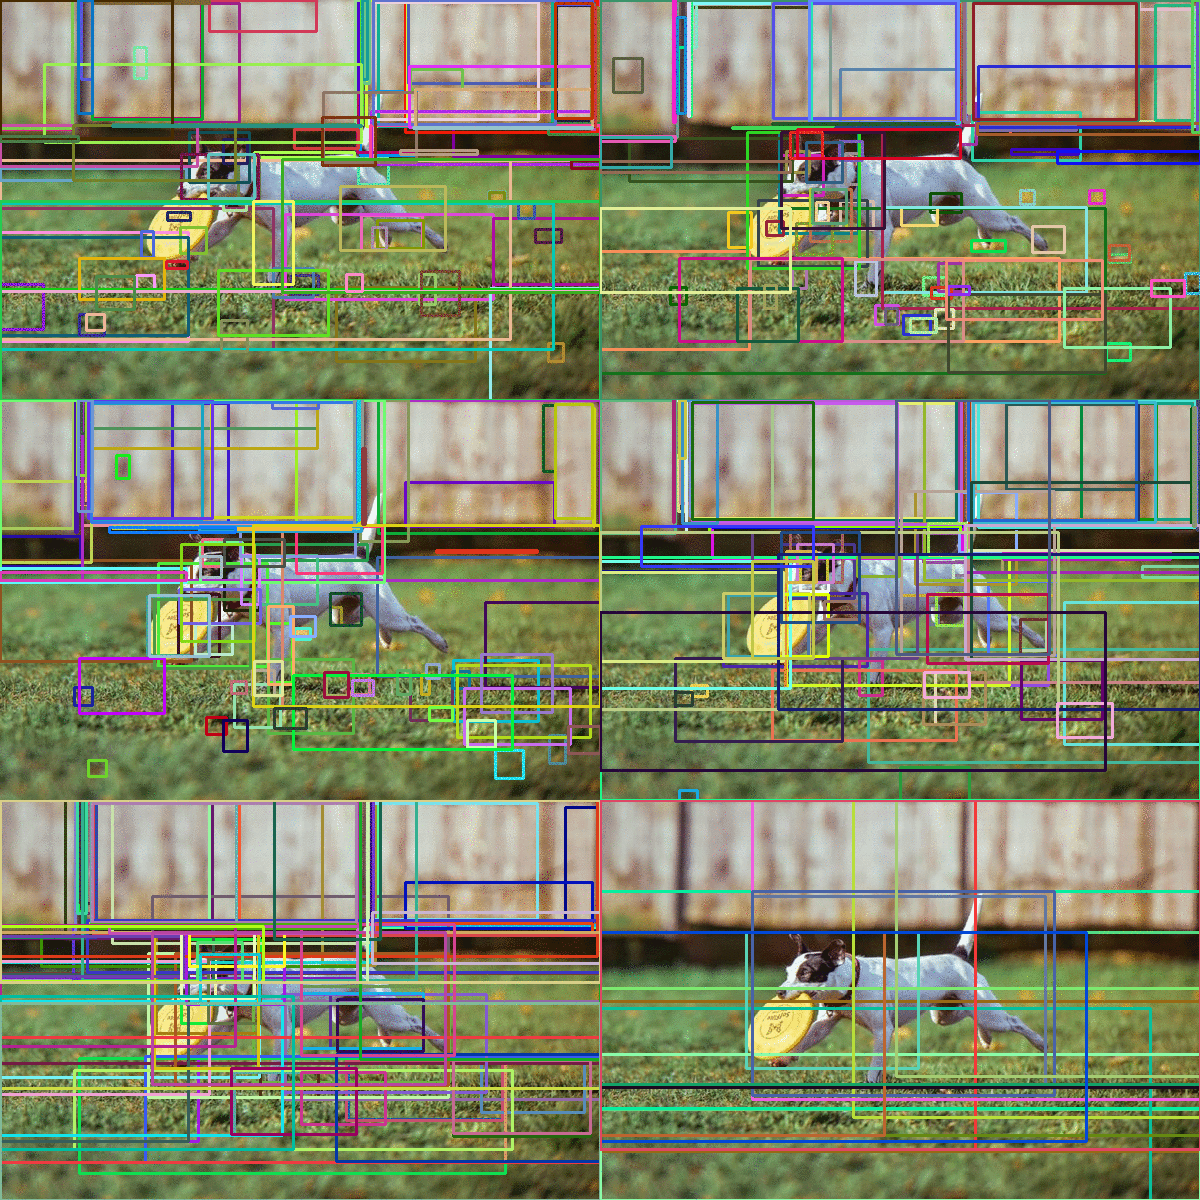
Region proposals algorithm genrates multiple Region of Interest (RoIs) assuming high likelihood of containing an object. Each generated bounding boxes has an objectness score.
Bounding boxes with high value of objectness score are then passed to next layers for further processing and RoIs with lower objectness scores are discarded.
Approches to generate region proposals
- Selective search algorithm
- Extracting the features through Deep neural network to generate regions.
Region proposals produces a lot of bounding boxes to be further analyzed and classified by the network. During this step, the network analyzes these regions in the image and classifies each region as foreground (object) or background (no object) based on its objectness score.
if the objectness score is above a certain threshold, then the region is considered a foreground and pushed forward in the network.
Trade-off with generating region proposals
-
If the threshold is too low the network generates all possible proposals, we will have a better chance of detecting all objects in an image but this comes with a computational cost and will slow down detection.
-
If the threshold is high the network may generate less proposals which may not produce the desired results.
The right approach is to use problem-specific informations to reduce the number of RoIs
2. Network predictions
We use pretrained CNN network trained on diverse datasets such as COCO or ImageNet dataset for the feature extraction to extract features from the input image and to use these features to determine the class of the image.
In this step, the network analyzes all the regions that have been identified as having a high likelihood of containing an object and makes two predictions for each region.
-
Bounding-box prediction - The coordinates that locate the box surrounding the object. The bounding box coordinates are represented as the tuple (x, y, w, h), where “x” and “y” are the coordinates of the center point of the bounding box and “w” and “h” are the width and height of the box
-
Class prediction: The softmax function that predicts the class probability for each object.

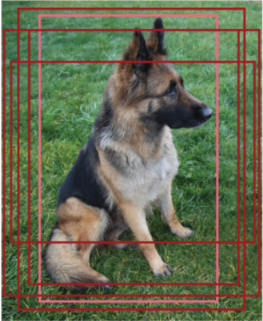
In the Region proposals step multiple regions are proposed, each object will always have multiple bounding boxes surrounding with the correct classification. If you look at the above image, the network was clearly able to find the object and succesfully classify it.But there are five RoIs produced in the previous steps: hence the five bounding boxes around the dog. But we need 1 bounding box per object.
To adress multiple bounding box issue, non max supression will be helpful.
3. Non-maximum supression (NMS)
The NMS is to reduce the number of candidate boxes to only one bounding box for each object.
NMS algorithm
-
Discard all bounding boxes that have predictions that are less than a certain threshold, called the confidence threshold. The box will be supressed if the prediction probability is less than the set threshold.
-
Look at all the remaining boxes, and select the bounding box with the highest probability.
-
Calculate the overlap of the remaining boxes that have the same class predictions. Bounding boxes that have high overlap with each other and that predict the same class are averaged toghether. This overlap is called intersection over union (IoU).
-
Supress any box that has an IoU value smaller than a certain threshold (called the NMS threshold). Usually the NMS threshold is equal to 0.5, but it is tunable.
4. Object detection metrics
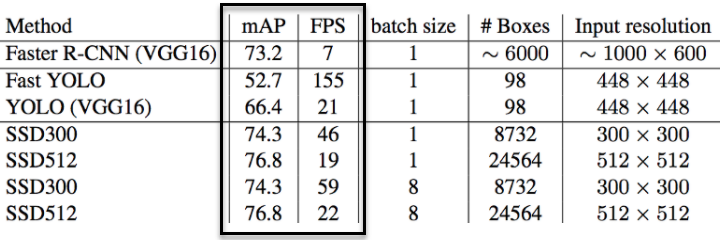
To evaluate the performance of the object detection model, we look for two metrics Frames per second and mean average precision (mAP).
Frames Per Second (FPS) to measure detection speed.
FPS metric is used to measure the detection speed. For example, Faster R-CNN operates at 7 FPS, whereas SSD operates at 59 FPS.Higher the speed better the model for deployment.
Example:

Mean Average Precision (mAP)
When we study research papers we often see mAP score while evaluating the performance of the model. Let’s know more about this metric
mAP metric has a scale from 0 to 100, and higher the mAP values are typically better. This metric value is different from the accuracy metric in classification tasks.
Intersection over union (IoU)
This measure evaluates the overlap between bounding boxes: the ground truth bounding box (B_groundtruth) and predicted bounding box (B_predicted)
The intersection over the union value ranges from 0 (no overlap) to 1 (thw two bounding boxes overlap each other 100%).

To calculate the IoU of a prediction
-
The ground truth BB: The annotated bounding box drawn during the labelling process
-
The predicted bounding box
We calculate the IoU by dividing the area of overlap by the area of the union
For example: Microsoft COCO, use mAP@0.5 (IoU threshold of 0.5) or mAP @ 0.75 (IoU threshold of 0.75). If the IoU value is above threshold, prediction is considered as a True positive (TP); if it is below threshold, it is considered as False Positive (FP).
Precision-Recall curve (PR curve)
With the TP and FP defined, we can now calculate the precision and recall of our detection for a given class across the testing dataset.

