Tutorial on Data Visualization with Matplotlib with Python
Part-1
Python 2D plotting library which produces publication quality figures in a variety of hardcopy formats and interactive environments across platforms
- Setting Global Parameters
- Basic Plots
- Histograms
- Concatenation of Histograms on the same plot
- Scatter Plots
import pandas as import pd
import numpy as np
import matplotlib.pyplot as plt
import seaborn
Setting Global Parameters
#set the global default size of matplotlib figures
plt.rc('figure',figsize=(10,5))
#set seaborn aesthetic parameters to defaults
seaborn.set()
Basic Plots
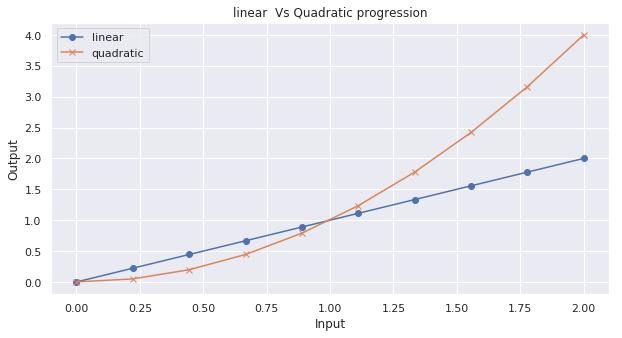
x=np.linspace(0,2,10)
plt.plot(x,x,'o-',label='linear')
plt.plot(x,x**2,'x-',label='quadratic')

plt.legend(loc='best')
plt.title('linear  Vs Quadratic progression')
plt.xlabel('Input')
plt.ylabel('Output')
plt.show()

Histograms
Gaussian, mean 1, standard deviation 0.5, 1000 elements
samples=np.random.normal(loc=1.0,scale=0.5,size=1000)
print(samples.shape)
print(samples.dtype)
print(samples[:30])
plt.hist(samples,bins=50)
plt.show()

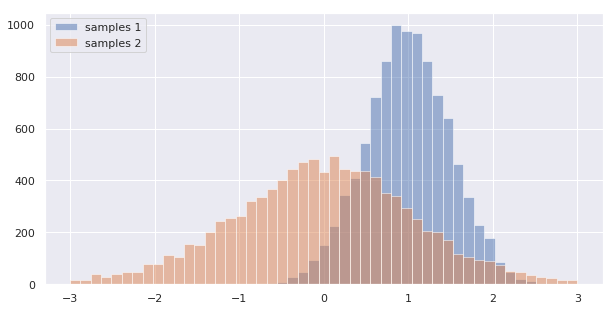
Blending two Histograms on the same plot
samples_1=np.random.normal(loc=1,scale=0.5,size=10000)
samples_2=np.random.standard_t(df=10,size=10000)
bins=np.linspace(-3,3,50)

#Set an alpha and use the same bins since we are plotting two hists
plt.hist(samples_1,bins=bins,alpha=0.5,label='samples 1')
plt.hist(samples_2,bins=bins,alpha=0.5,label='samples 2')
plt.legend(loc='upper left')
plt.show()

Scatter Plots
plt.scatter(samples_1,samples_2,alpha=0.1)
plt.show()

Part-2
Matplotlib applied
Apply matplotlib visualizations to kaggle competitions for exploratory data analysis. Learn how to create barplots, histograms, subplot2grid, normalized plots, scatter plots, subplots, and kernel densityestimation plots.
Applying Matplotlib Visualizations to kaggle: Titanic
prepare the titanic data to plot
df_train=pd.read_csv('t_train.csv')
Bar Plots, Histograms, subplot2grid
# Size of matplotlib figures that contain subplots
figsize_with_subplots = (10, 10)

# Set up a grid of plots
fig = plt.figure(figsize=figsize_with_subplots)
fig_dims = (3, 2)

#plot death and survival counts
plt.subplot2grid(fig_dims,(0,0))
df_train['survived'].value_counts().plot(kind='bar',title='Death andSurvival Counts',
                                         color='r',align='center')
# Plot Sex counts
plt.subplot2grid(fig_dims, (1, 0))
df_train['sex'].value_counts().plot(kind='bar',
                                    title='Gender Counts')
plt.xticks(rotation=0)

#plot Pclass counts
plt.subplot2grid(fig_dims,(0,1))
df_train['pclass'].value_counts().plot(kind='bar',title='Passenger Class Counts')

#plot Embarked counts
plt.subplot2grid(fig_dims,(1,1))
df_train['embarked'].value_counts().plot(kind='bar',title='Ports of Embarked Counts')

#plot the Age histogram
plt.subplot2grid(fig_dims,(2,0))
df_train['age'].hist()
plt.title('Age Histogram')

Normalized plots
pclass_xt = pd.crosstab(df_train['pclass'], df_train['survived'])

# Normalize the cross tab to sum to 1:
pclass_xt_pct = pclass_xt.div(pclass_xt.sum(1).astype(float), axis=0)

pclass_xt_pct.plot(kind='bar',
                   stacked=True,
                   title='Survival Rate by Passenger Classes')
plt.xlabel('Passenger Class')
plt.ylabel('Survival Rate')

# Plot survival rate by Sex
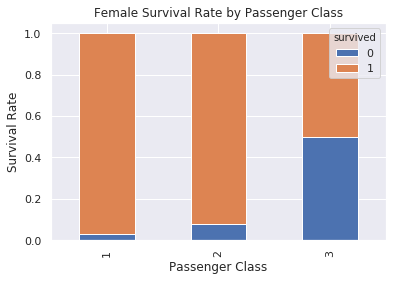
females_df = df_train[df_train['sex'] == 'female']
females_xt = pd.crosstab(females_df['pclass'], df_train['survived'])
females_xt_pct = females_xt.div(females_xt.sum(1).astype(float), axis=0)
females_xt_pct.plot(kind='bar',
                    stacked=True,
                    title='Female Survival Rate by Passenger Class')
plt.xlabel('Passenger Class')
plt.ylabel('Survival Rate')

# Plot survival rate by Pclass
males_df = df_train[df_train['sex'] == 'male']
males_xt = pd.crosstab(males_df['pclass'], df_train['survived'])
males_xt_pct = males_xt.div(males_xt.sum(1).astype(float), axis=0)
males_xt_pct.plot(kind='bar',
                  stacked=True,
                  title='Male Survival Rate by Passenger Class')
plt.xlabel('Passenger Class')
plt.ylabel('Survival Rate')

Part-3
Density and Contour plots
Sometimes it is useful to diplay three-dimensional data in two dimensions using contours or color-coded regions. there are three Matplotlib functions that can be helpful for this task:
plt.contour-for contour plots
plt.contourf-for filled contour plots
plt.imshow- for showing images.
This section looks at several examples of using these. we will start by setting up the notebook for plotting and importing the functions we will use:
import matplotlib.pyplot as plt
plt.style.use('seaborn-white')
import numpy as np
Visualizing a Three-Dimensional function
we will plot contour plot using a function \(z=f(x,y)\)
def f(x,y):
  return np.sin(x)**10+np.cos(10 + y *x)*np.cos(x)
plt.contour-A contour plot can be created with function.
contour plot needs three arguments
- A grid of x values
- A grid of y values
- A grid of z values The x and y values represent positions on the plot and the z values will be represented by the contour levels.
- np.meshgrid- Builds two-dimensional grids from 1-Dimensional arrays
x = np.linspace(0, 5, 50)
y = np.linspace(0, 5, 40)

X, Y = np.meshgrid(x, y)
Z = f(X, Y)
plt.contour(X,Y,Z,colors='black')

The lines can be color coded by specifying a colormap with cmap argument. we will specify that we want more lines to be drawn-20 equally spaced intervals within the data range.
plt.contour(X,Y,Z,20,cmap='RdGy')
we will use partially transparent backgroung image (with transparency set via the alpha parameter) and overplot contours with labels on the contours with labels on the contours themselves (using the plt.clabel() function)
contours = plt.contour(X, Y, Z, 3, colors='black')
plt.clabel(contours, inline=True, fontsize=8)

plt.imshow(Z, extent=[0, 5, 0, 5], origin='lower',
           cmap='RdGy', alpha=0.5)
plt.colorbar();


